Understanding music (with query modules)
This article is part of a series intended to show users how to use Memgraph on real-world data and, by doing so, retrieve some interesting and useful information.
We highly recommend checking out the other articles from this series which are listed in our tutorial overview section.
Introduction
Getting useful information from your data is always challenging. With Memgraph, you can manipulate and extract a huge amount of information by writing queries. Memgraph even offers a set of built-in graph algorithms. You can use those algorithms in your queries, extending your power over the data. But what if you wanted to do more?
At its core, Memgraph "simply" builds a graph from your data. Graphs were always interesting to scientists and engineers because of their interesting properties allowing you to represent a specific kind of data in an intuitive way which makes extracting useful information much easier. A field called graph theory emerged in mathematics, producing a great number of algorithms, metrics, and other functions that are applied to the graphs.
Memgraph allows you to use the underlying graph in your functions by using
Query modules, and those functions are called procedures. In this tutorial,
we'll see how easy it is to extend the capabilities of Memgraph using Python. It
will also show you how to use one of the most popular Python libraries for
graphs, called NetworkX, which contains an insane
amount of functions and algorithms for the graphs.
Data model
Social graphs is a relatively recent term. Simply said, it's a representation of a social network. Social networks appear in various sites, e.g., Youtube, which is primarily a site for watching videos, can be classified as a social network. For this tutorial, we'll use data consisting of users of the music streaming platform called Deezer.
The data consists of around 50k Deezer users from Croatia, but we prepared a subset of the dataset only composed of 2k users. Each user is defined by id and a list of genres he loved. The edges represent the mutual friendship between the users. You can find a more detailed explanation of the dataset on the GitHub alongside many more similar datasets kindly provided by the same authors.
Importing the dataset
To import the dataset, download the Memgraph
Lab desktop application and navigate to the
Datasets tab in the sidebar. From there, choose the dataset Music genres social network and continue with the tutorial.
Defining a directory with query modules
We need to set up the directory from which Memgraph will search for custom query
modules by changing the --query-modules-directory flag in the main
configuration file(/etc/memgraph/memgraph.conf) or by supplying it as a
command-line parameter using the directory containing our modules as the value.
For a more detailed explanation take a look at Load and call query
modules.
sudo -u memgraph /usr/lib/memgraph/memgraph --query-modules-directory=/modules
When using Memgraph installed from a DEB or RPM package, the currently running Memgraph server may need to be stopped. The user can do so using the following command:
systemctl stop memgraph
When using Docker, the query module directory can be mounted with the following command:
docker run -it -p 7687:7687 \
  -v $(pwd)/modules:/modules \
  -e MEMGRAPH="--query-modules-directory=/modules" \
  memgraph
Example queries and procedures
First, let's create a Python script in our modules directory which will contain
our procedures. We'll name the script deezer_example.py.
After each change to the script, we need to tell Memgraph to reload all the modules. We can do that by calling the following command:
CALL mg.load_all();
Let's count how many times a specific genre occurs in our network!
We will define a procedure called genre_count:
import mgp


@mgp.read_proc
def genre_count(context: mgp.ProcCtx,
                genre: str) -> mgp.Record(genre=str, count=int):
    count = len(
        [v for v in context.graph.vertices if genre in v.properties['genres']])
    return mgp.Record(genre=genre, count=count)
Let's reload the modules and check the results:
CALL deezer_example.genre_count("Pop")
YIELD *;
We can notice multiple things:
- import of the
mgpmodule which contains helper functions and types for defining custom procedures @mgp.read_procdecorator which marks the function as a procedure- every argument is annotated with a type
- result is defined as an object of
mgp.Recordwhich also has annotated types of its members
This example is probably not that interesting to you because we can get the same result using the following query:
MATCH (n)
WITH n, "Pop" AS genre
WHERE genre IN n.genres
RETURN genre, count(n);
Let's try something more interesting. The genres are listed in the order the users have added them. If we assume that users picked the genres in order of preference, let's write a function that tells us in what percentage each genre appears in top n places.
from collections import defaultdict


@mgp.read_proc
def in_top_n_percentage(context: mgp.ProcCtx,
                        n: int) -> mgp.Record(genre=str,
                                              percentage=float,
                                              size=int):
    genre_count = defaultdict(lambda: {'total_count': 0, 'in_top_n_count': 0})

    for v in context.graph.vertices:
        for index, genre in enumerate(v.properties['genres']):
            genre_count[genre]['total_count'] += 1
            genre_count[genre]['in_top_n_count'] += index < n

    def get_record(genre, counts): return mgp.Record(
        genre=genre,
        percentage=counts['in_top_n_count'] / counts['total_count'],
        size=counts['total_count']
    )

    return [get_record(
        genre,
        counts) for genre,
        counts in genre_count.items()]
Let's see what we got:
CALL deezer_example.in_top_n_percentage(3)
YIELD *
WITH genre, percentage, size
WHERE size > 10
RETURN genre, percentage, size
ORDER BY percentage DESC;
As said in the introduction, we want to use the power of the graphs to extract
some useful information from our data which would be otherwise impossible. Most
of those functions are complex and writing them from scratch would be tedious.
As every modern programmer, we'll just use a package that has everything we need
and more. To be precise, we'll be using NetworkX that has a huge amount of
utility functions and graph algorithms implemented.
To use NetworkX algorithms we need to transform our graph to a type NetworkX
recognizes. In our case, we need to use an undirected graph networkX.Graph. To
make our lives easier, let's write a helper function that transforms Memgraph
graph to networkX.Graph.
import networkx as nx
import networkx.algorithms as nxa
import itertools


def _create_undirected_graph(context: mgp.ProcCtx) -> nx.Graph:
    g = nx.Graph()

    for v in context.graph.vertices:
        context.check_must_abort()
        g.add_node(v)

    for v in context.graph.vertices:
        context.check_must_abort()
        for e in v.out_edges:
            g.add_edge(e.from_vertex, e.to_vertex)

    return g
Now let's get some information about the graph. As our data represents social network we would like to know if it has bridges and we would like to calculate the average clustering.
@mgp.read_proc
def analyze_graph(
        context: mgp.ProcCtx) -> mgp.Record(
        average_clustering=float,
        has_bridges=bool):
    g = _create_undirected_graph(context)
    return mgp.Record(
        average_clustering=nxa.average_clustering(g),
        has_bridges=nxa.has_bridges(g))
And to get and display the data let's run the following command:
CALL deezer_example.analyze_graph()
YIELD *;
Another interesting property of a node in a graph is its centrality. Centrality tells us how important a node is for a graph. In our case, it would mean higher the centrality, the more popular the user is. Let's find out which user is the most popular in our network and take a peek at his/her music taste. We will use the betweenness centrality.
@mgp.read_proc
def betweenness_centrality(
        context: mgp.ProcCtx) -> mgp.Record(node=mgp.Vertex,
                                            centrality=mgp.Number):
    g = _create_undirected_graph(context)
    return [mgp.Record(node=node, centrality=centrality)
            for node,
            centrality in nxa.centrality.betweenness_centrality(g).items()]
Now let's take a look at the results:
CALL deezer_example.betweenness_centrality()
YIELD *
RETURN node.id, node.genres, centrality
ORDER BY centrality DESC
LIMIT 10;
NOTE
Calculating betweenness centrality for each node can take some time to finish.
The issue of slower NetworkX implementations is something we at Memgraph would
like to address in the future. An example of this can be seen in the next
section of this tutorial.
For our last trick, let's try to locate communities inside our network.
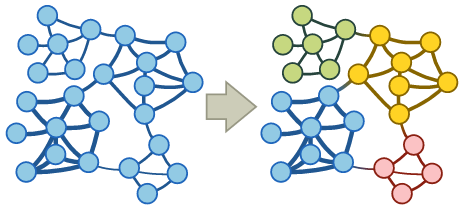
Communities are a set of nodes that are densely connected. The goal of the
community detection algorithms can be nicely described with the next
visualization: 
As for centrality, there are multiple algorithms for finding communities in a graph. We will write a function that takes a method for calculating communities, uses it to find the communities, and, optionally, calculates some metrics specific to the graph partitioning so we can compare algorithms. To make things more interesting, let's find out which genre is the most popular in the community and return the percentage which tells us how many of the users have that genre on their list. In the end, music is something that connects us!
def _get_communities(
        context: mgp.ProcCtx,
        community_function,
        calculate_quality: bool):
    g = _create_undirected_graph(context)

    communities = list(community_function(g))

    if calculate_quality:
        quality = {
            'coverage': nxa.community.quality.coverage(g, communities),
            'modularity': nxa.community.quality.modularity(g, communities),
            'performance': nxa.community.quality.performance(g, communities)
        }
    else:
        quality = {}

    communities = [list(community) for community in communities]

    def get_community_info(community):
        info = {
            'size': len(community),
        }

        genre_count = defaultdict(lambda: 0)
        for genre in itertools.chain(
                *[user.properties["genres"] for user in community]):
            genre_count[genre] += 1

        if len(genre_count) != 0:
            mpg = max(
                genre_count.items(),
                key=lambda item: item[1])

            info['most_popular_genre'] = mpg[0]
            info['most_popular_genre_percentage'] = mpg[1] / info['size']

        return info

    return mgp.Record(communities=[get_community_info(c)
                                   for c in communities], quality=quality)
Now that we have our function in place let's test some algorithms. We will be checking out community detection using greedy modularity maximization by Clauset-Newman-Moore and label propagation.
@mgp.read_proc
def greedy_modularity_communities(
        context: mgp.ProcCtx,
        calculate_quality: bool = False) -> mgp.Record(
        communities=list,
        quality=mgp.Map):
    return _get_communities(
        context,
        nxa.community.greedy_modularity_communities,
        calculate_quality)


@mgp.read_proc
def label_propagation_communities(
        context: mgp.ProcCtx,
        calculate_quality: bool = False) -> mgp.Record(
        communities=list,
        quality=mgp.Map):
    return _get_communities(
        context,
        nxa.community.label_propagation_communities,
        calculate_quality)
In the above snippet, we can notice an optional argument calculate_quality and
usage of the type mgp.Map which is provided by Memgraph.
Let's see the results with:
CALL deezer_example.greedy_modularity_communities()
YIELD communities
UNWIND communities as community
WITH community
WHERE community.size > 10
RETURN community.most_popular_genre, community.most_popular_genre_percentage, community.size
ORDER BY community.size DESC;
and
CALL deezer_example.label_propagation_communities()
YIELD communities
UNWIND communities AS community
WITH community
WHERE community.size > 10
RETURN community.most_popular_genre, community.most_popular_genre_percentage, community.size
ORDER BY community.size DESC;
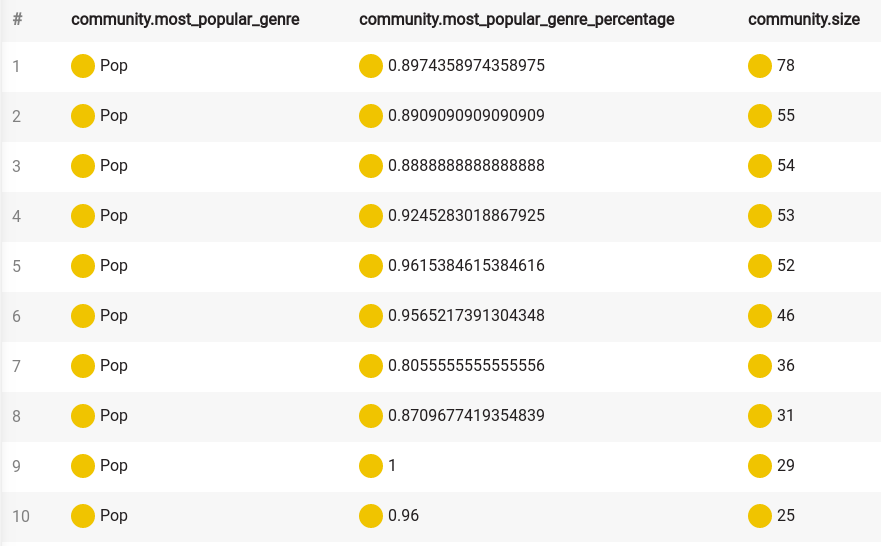
Your results should look something like this:

Hmm, Pop sure is popular. Let's ignore that genre:
for genre in itertools.chain(
        *[user.properties["genres"] for user in community]):
    if genre != 'Pop':
        genre_count[genre] += 1
and call our procedures again for each algorithm. Well, people always liked to dance!
We saw the biggest communities in our network using two different methods. It's
hard to say which of the methods did better so let's check a couple of metrics
by calling the same procedure with calculate_quality set to true:
CALL deezer_example.greedy_modularity_communities(true)
YIELD communities, quality
RETURN quality;
and
CALL deezer_example.label_propagation_communities(true)
YIELD communities, quality
RETURN quality;
I think it should come as no surprise that an algorithm that maximizes modularity has higher modularity...
Optimized NetworkX integration
As noted before, we at Memgraph are aware of NetworkX's potential but the performance for some functions isn't that good. We decided to tackle this problem by writing a wrapper object for Memgraph's graph and with smarter usage of NetworkX algorithms. To make things even more convenient, we decided to implement procedures that call NetworkX functions with our graphs, so you have out-of-the-box access to the graph algorithms. NetworkX contains a huge amount of functions, and writing procedures for all of them require insane effort, so don't blame us if some of the algorithms aren't available. We are always open to any feedback, so if you think that an implementation for an algorithm is needed, we will surely take that into account.
To demonstrate performance improvement, we will calculate the betweenness centrality again, this time by using Memgraph's procedure.
To get access to the NetworkX procedures, start your Memgraph server without
modifying the query modules directory path. That way, the path will be set to
the default path, which contains nxalg module.
Now let's call the procedure:
CALL nxalg.betweenness_centrality()
YIELD *
RETURN node.id, node.genres, betweenness
ORDER BY betweenness DESC
LIMIT 10;
You should get the same results as with our previous procedure for the betweenness centrality but in a much lower time.
Further reading
We encourage you to take a look at our How to for the modules at the How to
Implement Query
Modules?.
This tutorial showed you how with a little effort you can extend your control
over the data. Using packages like NetworkX you get a huge amount of already
implemented graph algorithms while Memgraph allows you complete access to its
internal graph.
If you are not a big fan of Python, don't worry! We have a C API with the exact same functionalities.