Graphing the Premier League
This article is a part of a series intended to show users how to use Memgraph on real-world data and, by doing so, retrieve some interesting and useful information.
We highly recommend checking out the other articles from this series which are listed in our tutorial overview section, where you can also find instructions on how to start with the tutorial.
Introduction
Football is a team sport played between two teams of eleven players with a spherical ball. The game is played on a rectangular pitch with a goal at each and. The object of the game is to score by moving the ball beyond the goal line into the opposing goal. The game is played by more than 250 million players in over 200 countries, making it the world's most popular sport.
In this article, we will present a graph model of a reasonably sized dataset of football matches across world's most popular leagues.
Data model
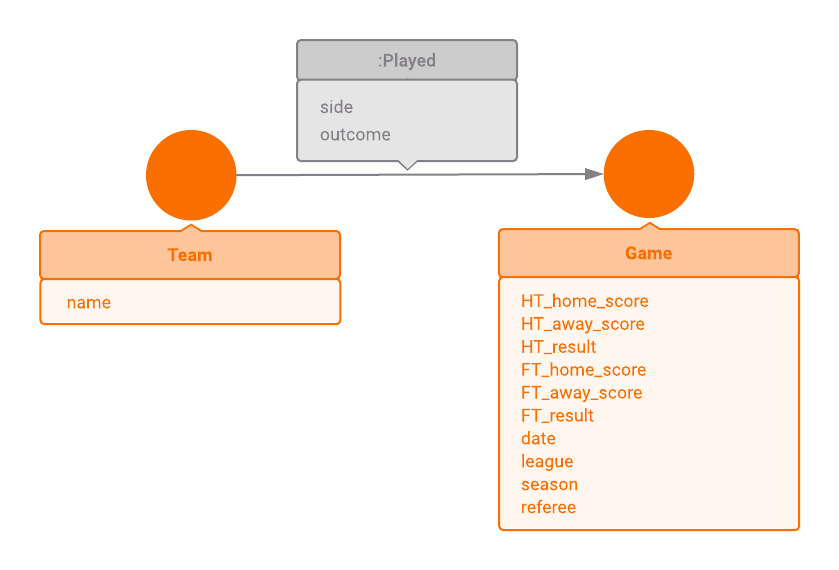
In essence, we are trying to model a set of football matches. All information
about a single match is going to be contained in three nodes and two edges. Two
of the nodes will represent the teams that have played the match, while the
third node will represent the game itself. Both edges are directed from the team
nodes to the game node and are labeled as :Played.
Every bit of information regarding the data model is nicely condensed in the following visual representation.

Exploring the dataset
You have two options for exploring this dataset. If you just want to take a look
at the dataset and try out a few queries, open Memgraph
Playground and
continue with the tutorial there. Note that you will not be able to execute
write operations.
On the other hand, if you would like to add changes to the dataset, download the
Memgraph Platform. Once you
have it up and running, open Memgraph Lab web application within the browser on
localhost:3000 and navigate to Datasets in the
sidebar. From there, choose the dataset Football Premier league games and
continue with the tutorial.
Example queries
1. You might wonder, what leagues are supported?
MATCH (n:Game)
RETURN DISTINCT n.league
ORDER BY n.league;
2. We have stored a certain number of seasons for each league. What is the oldest/newest season we have included?
MATCH (n:Game)
RETURN DISTINCT n.league AS league, min(n.season) AS oldest, max(n.season) AS newest
ORDER BY league;
3. You have already seen one game between Chelsea and Arsenal, let's list all of them in chronological order.
MATCH (n:Team {name: "Chelsea"})-[e:Played]->(w:Game)<-[f:Played]-(m:Team {name: "Arsenal"})
RETURN w.date AS date, e.side AS chelsea, f.side AS arsenal,
       w.FT_home_score AS home_score, w.FT_away_score AS away_score
ORDER BY date;
4. How about filtering games in which Chelsea won?
MATCH (n:Team {name: "Chelsea"})-[e:Played {outcome: "won"}]->
      (w:Game)<-[f:Played]-(m:Team {name: "Arsenal"})
RETURN w.date AS date, e.side AS chelsea, f.side AS arsenal,
       w.FT_home_score AS home_score, w.FT_away_score AS away_score
ORDER BY date;
5. Home field advantage is a thing in football. Let's list the number of home defeats for each Premier League team in the 2016/2017 season.
MATCH (n:Team)-[:Played {side: "home", outcome: "lost"}]->
      (w:Game {league: "ENG-Premier League", season: 2016})
RETURN n.name AS team, count(w) AS home_defeats
ORDER BY home_defeats, team;
6. At the end of the season the team with the most points wins the league. For each victory, a team is awarded 3 points and for each draw it is awarded 1 point. Let's find out how many points did reigning champions (Chelsea) have at the end of 2016/2017 season.
MATCH (n:Team {name: "Chelsea"})-[:Played {outcome: "drew"}]->(w:Game {season: 2016})
WITH n, count(w) AS draw_points
MATCH (n)-[:Played {outcome: "won"}]->(w:Game {season: 2016})
RETURN draw_points + 3 * count(w) AS total_points;
7. In fact, why not retrieve the whole table?
MATCH (n)-[:Played {outcome: "drew"}]->(w:Game {league: "ENG-Premier League", season: 2016})
WITH n, count(w) AS draw_points
MATCH (n)-[:Played {outcome: "won"}]->(w:Game {league: "ENG-Premier League", season: 2016})
RETURN n.name AS team, draw_points + 3 * count(w) AS total_points
ORDER BY total_points DESC;
8. People have always debated which of the major leagues is the most exciting. One basic metric is the average number of goals per game. Let's see the results at the end of the 2016/2017 season. WARNING: This might shock you.
MATCH (w:Game {season: 2016})
RETURN w.league, avg(w.FT_home_score) + avg(w.FT_away_score) AS avg_goals_per_game
ORDER BY avg_goals_per_game DESC;
9. Another metric might be the number of comebacks—games where one side was winning at half time but were overthrown by the other side by the end of the match. Let's count such occurrences during all supported seasons across all supported leagues.
MATCH (g:Game)
WHERE (g.HT_result = "H" AND g.FT_result = "A") OR
      (g.HT_result = "A" AND g.FT_result = "H")
RETURN g.league AS league, count(g) AS comebacks
ORDER BY comebacks DESC;
10. Exciting leagues also tend to be very unpredictable. On that note, let's list all triplets of teams where, during the course of one season, team A won against team B, team B won against team C and team C won against team A.
MATCH (a)-[:Played {outcome: "won"}]->(p:Game {league: "ENG-Premier League", season: 2016})<--
      (b)-[:Played {outcome: "won"}]->(q:Game {league: "ENG-Premier League", season: 2016})<--
      (c)-[:Played {outcome: "won"}]->(r:Game {league: "ENG-Premier League", season: 2016})<--(a)
WHERE p.date < q.date AND q.date < r.date
RETURN a.name AS team1, b.name AS team2, c.name AS team3;